The Revolution Will be Visualized
I believe that drawing skills will soon rival the importance of reading and writing in our schools. Does that seem nuts in an age when the arts are often the first cut from school budgets? I don’t think so. I think we’re amidst a major cultural shift in the way we communicate — particularly online.
We’ve got more words to read than ever before — and this has resulted in a general sense of information overload. Is it any wonder, then, that we’re so obsessed with videos, info-graphics, visual resumés and Pinterest?
We’re drowning in words. Images give us a life raft.
We love images, in fact our brains prefer them — and until a relatively recent few thousand years ago, images were our dominant mode of communication. Dan Roam, who has made it his life’s work to teach guys in suits how to get comfortable with a set of markers, writes often about the steep cost of our cultural bias towards verbal-oriented thinking, and simultaneous dismissal of drawing silly stick figures. He wrote a fascinating manifesto for ChangeThis about how this happened called The 5000-year History of How We Lost Half Our Minds(spoiler alert: blame the Phoenicians.)
It’s possible that this 5,000-year detour into written communication is undergoing a dramatic course correction. Not only does cheap bandwidth and unprecedented access to technology make it easy to create and distribute images and video, we’re desperate for them due to the simple fact that we simply cannot process unlimited textual information. The simple fact of the matter is this: our brains are much better and faster at reading visual information.
Shortcut to the Brain
Compare the time it takes you to comprehend this sentence…
The quick brown fox jumps over the lazy dog.
…And the time it takes you to comprehend this image:
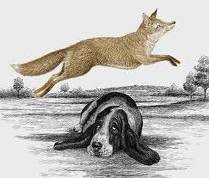
It’s not much of a contest, and really a trick, because I’m willing to bet that the image above was one of the first things you “read” in this post.
The Picture Superiority Effect
You can thank something called the picture superiority effect for this. Instead of explaining what that is, why don’t I just show you?
This grid represents the sensory processing capacity of your brain:
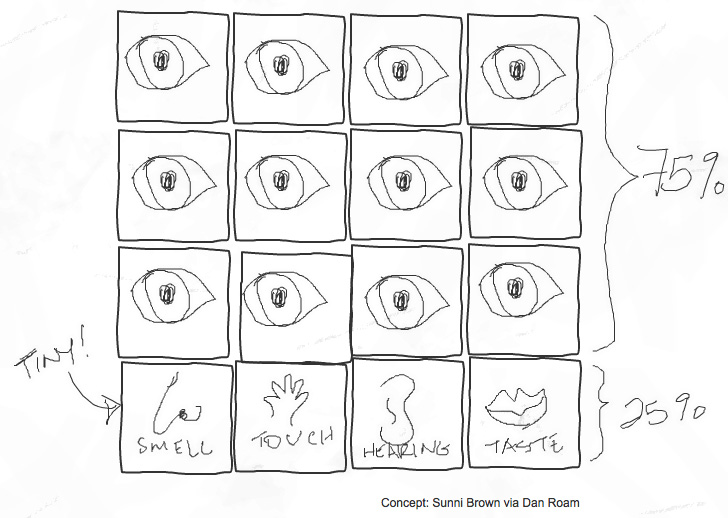
Translation: 75% of your brain’s sensory processing is dedicated to visual information.
We consume images so quickly and easily that it barely feels like thinking. Comparatively, reading text is like performing mental gymnastics. A more appropriate metaphor might be that viewing an image is like lifting a heavy weight with an entire muscle group, and reading words is like lifting that same weight with your index finger alone.
Not Just Eye Candy
I won’t get on my soapbox here about how harmful it is to urge kids to abandon drawing “childish pictures” after 6th grade and focus only on written communication. I think this the cognitive equivalent of discouraging them to use their left hand in favor of their right. We’re not even talking about teaching the arts per se — it doesn’t matter what the artistic quality of the image is for it to be effective (see my drawing above). It turns out that the very act of doodling improves cognition and recall by X%. We should be encouraging drawing in classrooms, as much as Dan Roam is encouraging it for conference rooms. (OK, I got on my soapbox).
What does this mean for you? It means that it would be a good idea to take your own visual literacy seriously. Not everything can or should be reduced to a cartoon, but here are just a few reasons to start building your visual thinking skill set:
- Working with visual devices supercharges problem solving
- Visual exercises support the writing process — from ideation to structure
- Sketching your ideas can help you explore and clarify your thoughts
- Visual content helps your ideas stand out and go farther, faster — bypassing the cognitive bottleneck created by too much text
- Understanding how to present your ideas visually will allow you to communicate more effectively with designers
- Doodling during class or a meeting actually enhances comprehension, retention and recall
- Learning to draw simple shapes will give you have an advantage when we revert back to using hieroglyphics.
Visuals are so delicious to our minds, they are such efficient ways to transfer information, that in his book Brain Rules, John Medina says “…there may be strong reasons for entire marketing departments to think seriously about making pictorial presentations their primary way of transferring information.”
As a writer who was a designer and is an artist, I couldn’t be more thrilled at this rich, visual online universe in which we find ourselves. I’m certainly not about to abandon the written word — with all it’s nuance and interpretive power. In fact, what could be better than the amazing alchemy of words and images?
Toolkit for the Visual Revolutionary
So what can you do to develop your visual literacy and begin creating your own? I’ve put together this toolkit to help get you started.
Build your visual vocabulary.
Sunni Brown is a graphic facilitator and an outspoken champion of doodling. Her post the Miseducation of the Doodle gives a great overview of the basic visual vocabulary anyone can use, and she also offers a great course called Visual Notetaking 101. There's also an assortment of other courses online at VizThinkU.
Also, check out books by Ed Emberley, I particularly like Make a World. Emberley shows you that you only need a few shapes and lines to draw everything. They'll make you feel like you're a kid again.
"Read" more visual information.
If you can learn a language by immersing yourself in it — speaking, reading, writing — then the same applies to becoming visually literate. Immerse yourself in visual language.
Browse the art and design section at your bookstore, where you'll also find magazines like Communication Arts and Print. Go to an art gallery, read comic books and graphic novels (it's not all about Spiderman, check out the amazing work of Chris Ware). Find art and design Tumblr blogs (check out this list for designers) and spend time browsing Pinterest for interesting examples of visual communication.
Understand the process of visualization.
How do you create visual representations of concepts and data? You can start by reading books like the Back of the Napkin and Blah Blah Blah by Dan Roam. If you're particularly interested in data visualization, read the work of Edward Tufte, or take his one-day workshop.
Find an interpreter.
Sometimes it helps to have someone help you translate your ideas into images. This can range from amazing illustrations by Marty of IdeaSchema, to straightforward stick figures to clarify and get your message across. For meetings and events, hire a graphic recorder or facilitator. (Want to become a graphic recorder? Check out AlphaChimp University.)
Special thanks to Sunni Brown, Austin Kleon and Dave Gray, whose panel at SXSW 2010 made all the lightbulbs come on.